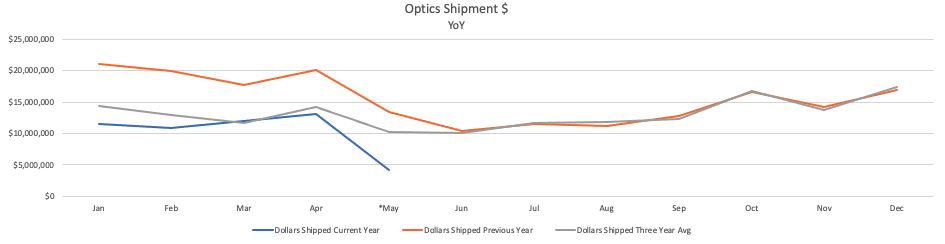
During “the Surge” in 2020 and 2021, firearm manufacturers saw an increase in demand for guns to accessories to optics.Ammo saw a massive spike in sales right away and then struggled to catch up on production, which led to high demand and low supply. Looking at the wholesaler shipment and sales data from the first half of 2022, sales of all optics appeared to shadow the decrease in the overall market and inventory mix as the surge curtailed. While all optic sales trended downward in the past year, SCOPE DLX data showed red dot sales declined at a sharper rate than other products within the mix of the optics market.
Compared to 2021, the optics market performed well below the benchmark, according to the SCOPE DLX data. Shipments for all optics decreased 39.5% between Jan 1 and April 30, compared to the same time period last year, while red dot sales dropped by 54.6% reducing their percentage in the overall mix of all optics by 8.8%.
For businesses evaluating their sales, it’s easy to compare their own results to previous years. This data provides a benchmark to which businesses can compare their results against the rest of the industry. “When we look at our data and see that we dropped 35% in red dot sales, but the rest of the industry is down 54%, we’ve done better than the market average,” said Chris DiCenso, President of Camfour. “This is why I’ve always been a big proponent of data. It helps us understand how we’re doing relative to our peers.”
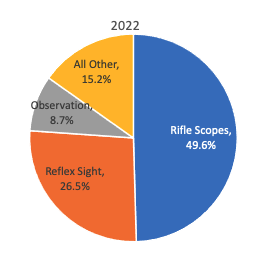
Year-over-year analysis showed rifle scopes held 49.6% of the overall mix for 2022 as opposed to 43.7% of the overall mix for 2021, showing that rifle scopes gained in market share despite the nearly 40% decrease in all optics sales. Not all companies have seen these same immediate results to date, but some have seen signs pointing toward this trend. Janos Jeszenszky, Director of Commercial Sales at Leupold & Stevens, said, “We've noticed the red dot market began to shift last spring as the availability of hunting rifle ammunition improved. As ammunition became available, mid-tier hunting rifle sales increased and rifle scope sales followed.”
Since many sellers intend to turn their inventory three to four times a year, SCOPE DLX used 13 weeks as the benchmark for available supply to determine the level of inventory. The data showed a decrease in sales of 44% in optics combined with the increase in weeks of supply (WOS), demonstrating a potential reduction in the productivity of inventory in optics overall, with the red dot sight sales being the greatest affected.
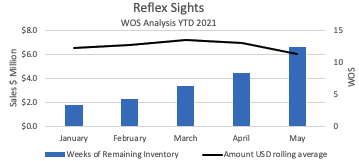
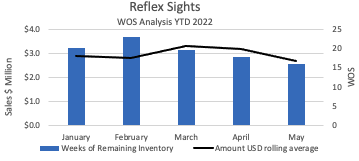
In 2021, the average WOS for red dot sights was less than five weeks, with a 13-week average of $6 million in sales. This inspired manufacturers to increase production and shipment of optics to replenish diminishing supplies. As sales began to decline from January through April of 2022, WOS increased, meaning more inventory was coming to and remaining on the floor. Looking at 2022 for the same time frame of January through April, the data reflected an average WOS of 16 weeks with a 13-week average of $3 million in sales, meaning one-third of the year’s inventory was likely sitting unsold.
Manufacturers such as Jeszenszky also saw similar increases in WOS. “I believe that the increased inventory and weeks of supply for red dots is driven by more product flooding the market.”
Data available in SCOPE DLX shows trends and demonstrates ways to make or save money for each business. With the sale of optics trending down, SCOPE DLX compiled this data with the intent to provide the best information for manufacturers to make decisions that work best for their businesses and allow sellers to prepare for potential future sales trends. During the slower summer months, manufacturers may find this a suitable time to plan how best to navigate their current red dot inventory in relation to this downward trend. Using available data to best decide how to turn excess inventory can assist in sales choices that suit each business.
“Knowing how we compare, I can now set a strategy on where I can grow easier,” said DiCenso. “When I’m investing money into these projects, I want to identify the segment that is most attractive with the greatest return on investment. I assumed optics was weak for us, but the data told me ‘yes’ and by how much.”